
In the second article on volatility [1], we discussed how to compare different international transactions on an equivalent basis to account for the impact differential on profitability generated by currencies. But integrating the use of volatility as an indicator of uncertainty into budget planning to support your decision-making can be a serious challenge.
In fact, your budget allows you to plan your income, your expenses, and track your goals. But what is the acceptable variability around your goal? Your budget is a means of controlling your business, it is the reference point of your performance. Using a “budget exchange rate” per currency makes it possible to mark the budget and quantify your objective; any deviation from the budget rate will lead to a deviation from the budget, favourable or not.
Therefore, it is necessary to identify the costs and/or sales abroad that are likely to contribute to these differences to quantify them at the budget rate. Then we have to make them comparable. To do this, it is necessary to link profitability and risk from the beginning of the budget process. Clearly perceive the sources of risk and decide according to the business strategy which ones are acceptable according to our risk tolerance and which ones will have to mitigate.
As illustrated above [2], for the same size of a commercial transaction [3] and the same expected profitability in reference currency, the Mexican transaction induces a potential variation 1.76 times greater than that in the United States (112%/63%)
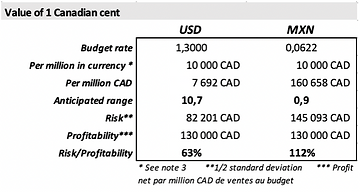
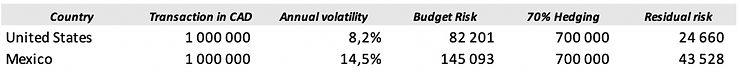
The profitability of one is more uncertain than the other. Therefore, using a coverage ratio of 70%, for example, across all of the company’s transactions may not be adequate.
Using the same coverage ratio implies that the company accepts almost 2 times more risk in Mexico per million CAD of transactions (CAD 43,528) than in the United States (CAD 24,660) after hedging.
It is the “game” of the advance price paid (import)/receipt (export), from which the profitability differential arises, and the coverage used that allows an effective comparison and choice. In our example, the 2 transactions generate an anticipated profit of 130,000 CAD.
An attempt should be made to increase profitability in Mexico through a price adjustment [4] and/or increase coverage on Mexican exposure to offset the risk differential until it is in line with the company’s tolerance for that market unless the company has made an informed choice to accept almost 2 times more risk in Mexico.
So, from the beginning of planning your budget, you need to give yourself an idea of the potential value of an overall gap for the company and then divide it by foreign market. Does it represent 10% or 50% of the anticipated profit in the company’s budget?
In our example, the 2 transactions each generate an anticipated profit of CAD 130,000. One with a difference of CAD 82,201 and the other 145,093. The overall potential spread (worst case) is CAD 227,294 on anticipated profitability of CAD 260,000. The potential gap is therefore 87% of the company’s anticipated profit. It is 68% of the profitability of the US market and 112% of the profitability of the Mexican market.
Is this potential gap of 87% within the company’s tolerance or rather, what part of this gap is acceptable and its corollary, what part will have to be covered? In which market(s)?
Therefore, at the time of budget planning, generating a table where the risk induced to the budget by each of the currencies used, is explicitly presented is a much better indicator of the risks and choices to be made and assumed by the company. This table becomes a simple and clear decision support tool.
In fact, knowing that the USD has a volatility of 8.2% while that of the MXN is 14.5% is incomplete information. Indeed, it does not express the amount of risk in functional currency compared to the expected profitability in each market in the case of an equivalent transaction.
The use of the volatility range (Standard Deviation) and the concept of the value of 1 CAD cent for a typical transaction of 1 million Canadian dollars equivalent allows a more efficient comparison of the risk imposed by different currencies on the company’s performance. Eventually, it becomes a much better support for your decision-making process.
[1] Read More: Two markets, one measure? How to assess the hidden currency risk in the budget
[2] Read more: Two markets, one measure? How to assess the hidden currency risk in the budget AND Currency risk: How to take volatility into account in your management?
[3] The impact of a 1 CAD cent change for a MXN 1 million commercial transaction or a $1 million commercial transaction is CAD 10,000. To properly compare volatility, we must work on the basis of a transaction of 1 million in reference currency (the functional currency) which, in our example, is the Canadian dollar. The anticipated range is based on annual volatility.
[4] Price, as far as competition in your market allows, is your first hedging instrument.
__________________________________________________________
International markets: a world of opportunities
Expanding business abroad is a source of growth, but it also entails risks for SMEs. It is also complex to monitor the successive impacts of exchange rates on the company’s anticipated performance.
D-Risk FX Budget & BI, offers SMEs performance, risk and test scenario analyses, broken down by market, currency and business line, with a tailor-made hedging strategy and real-time monitoring of the company’s anticipated performance.
Gain autonomy, automate your processes and approach your foreign markets with the security of a clear foreign exchange risk management strategy and monitoring that matches your ambitions.